HOCHWERTIG | 650 m² HALLE | 800 m² AUSSTELLUNG
ID: 998947DetailsGarching, repräsentatives Produktionsgebäude mit hochwertigen Büroflächen
ID: 93135Detailsca. 400 m² große, ebenerdige Lager-Produktionshalle mit Meisterbüro in Top Lage
ID: 1036679DetailsDirekt am Autobahnkreuz Ulm/Elchingen - Neubau multifunktionaler Logistik- und Produktionsflächen
ID: 994300DetailsLOGISTIK | RAMPEN | FREIFLÄCHE
ID: 1008605DetailsLager-/Logistik | Neubau | Rampen | teilbar | ebenerdig
ID: 1016255DetailsGEWERBEPARK | ERSTBEZUG | TOP-LAGE
ID: 996681DetailsBremen, ca. 1.300 m² Lager-/ Logistikfläche zu vermieten
ID: 1032273DetailsMünchen - Nord, Hallen- und Freiflächen in Bestlage zu vermieten
ID: 101077DetailsPROVISIONSFREI | GEWERBEPARK | FLEXIBEL
ID: 1000973DetailsArnsdorf | ca. 9.000 m² | Lager & Logistik | Betonrampe & ebenerdig | teilbar ab 2.000
ID: 1009874DetailsRepräsentativer Gewerbepark
ID: 1005086Detailsca. 1.350 m² große, ebenerdige Hallenfläche mit Büro
ID: 1035432DetailsPRODUKTION | LAGER | RAMPE
ID: 991522DetailsGarching, Neubau von ca. 8.000 m² Lager-,Forschungs- und Bürofläche
ID: 1030576DetailsMunich-North, warehouse and office spaces for rent
ID: 1033335DetailsMunich-North, warehouse and office spaces for rent
ID: 1024609DetailsMunich-North, warehouse and office spaces for rent
ID: 1034331DetailsMunich-North, warehouse and office spaces for rent
ID: 1002692DetailsMunich-North, warehouse and office spaces for rent
ID: 1034768DetailsMunich-North, warehouse and office spaces for rent
ID: 1034670DetailsMunich-North, warehouse and office spaces for rent
ID: 1034767DetailsMunich-North, warehouse and office spaces for rent
ID: 1025539DetailsMunich-North, warehouse and office spaces for rent
ID: 1010949DetailsMunich-North, warehouse and office spaces for rent
ID: 1032598DetailsAugsburg, site with about 2.500 sqm for rent
ID: 9040DetailsAugsburg, site with about 2.500 sqm for rent
ID: 1031912DetailsAugsburg, site with about 2.500 sqm for rent
ID: 1031769DetailsAugsburg, site with about 2.500 sqm for rent
ID: 1031836DetailsAugsburg, site with about 2.500 sqm for rent
ID: 1028145DetailsAugsburg, site with about 2.500 sqm for rent
ID: 1030724DetailsAugsburg, site with about 2.500 sqm for rent
ID: 1030615DetailsAugsburg, site with about 2.500 sqm for rent
ID: 1023871DetailsGladback, warehousing space for wholesale or retail for rent
ID: 95769DetailsGladback, warehousing space for wholesale or retail for rent
ID: 1013489DetailsDüsseldorf Stadtmitte | ca. 462 m² Lagerfläche | Büro | ebenerdig
ID: 1025426DetailsDüsseldorf Stadtmitte | ca. 462 m² Lagerfläche | Büro | ebenerdig
ID: 1026621DetailsDüsseldorf Stadtmitte | ca. 462 m² Lagerfläche | Büro | ebenerdig
ID: 1022435DetailsDüsseldorf Stadtmitte | ca. 462 m² Lagerfläche | Büro | ebenerdig
ID: 1023380DetailsDüsseldorf Stadtmitte | ca. 462 m² Lagerfläche | Büro | ebenerdig
ID: 1014315DetailsNeuss, approx. 1,295 sqm warehouse space in a business park for rent
ID: 997156DetailsBERLIN-FRIEDRICHSHAIN | ca. 1.560 m² | EXKLUSIVE MIETFLÄCHE IM ZENTRUM
ID: 1017665DetailsBERLIN-FRIEDRICHSHAIN | ca. 1.560 m² | EXKLUSIVE MIETFLÄCHE IM ZENTRUM
ID: 1019585Details
Do you have a question? Leave your contact details here and we will call you back!

Market report Berlin half year 2023
- About the logistics market in the economic region
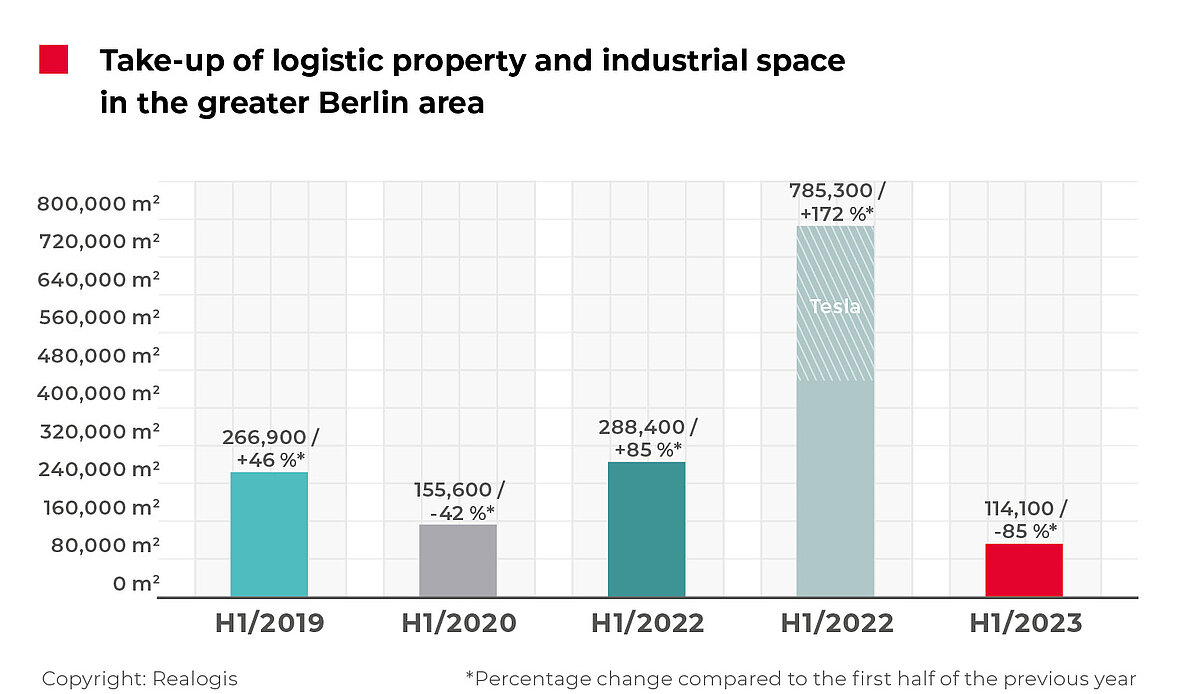
Take-up on the Berlin industrial and logistics property market shrinks by 85% in the first half of the year
With take-up of 114,100 m², the Berlin rental and owner-occupied market for logistics and industrial properties saw the weakest first half of a year since we began keeping records. According to our data, take-up by all market participants in the first six months therefore plummeted by 85.5% year on year.
However, H1 2022 was an outlier year with 785,300 m², triggered by the Tesla deal for 327,000 m². But even without this major deal, the decline from 458,300 m² would still amount to -75.1%. At 148,500 m², the first half of this year was a substantial 23.2% lower than the previous weakest first half of a year (2015) as well as 64.6% short of the five-year average for the first half of the year at 322,060 m².
Facts
- Below the weakest comparative period H1 2015 at 114,100 m²
- -64.6% short of the five-year average for the first half of the year
- Share of new properties almost completely collapsed
- Nearly 40% fewer leases concluded than in the same period of the previous year
Lettings in new builds collapse almost completely
Lettings in both new builds and existing properties have plummeted in absolute terms. New builds are particularly notable, however, for dropping to virtually zero year on year. Compared to 655,600 m² in H1 2022, we saw a decline of 96.5% to take-up of 23,000 m² in H1 2023. We have not seen a collapse of this kind or such a low figure for lettings in new builds since our records began.
Biggest deals
Bär und Ollenroth KG, Berlin North, approx. 15,300 m² (Expansion), Retail
BLG LOGISTICS GROUP AG & Co. KG, Berlin West, approx. 8,000 m² (Expansion), Logistics
Flink SE, Surrounding area south of Berlin, approx. 6,120 m² (Expansion), E-commerce
Staatsoper Unter den Linden - Stiftung Oper in Berlin, Berlin South, approx. 6.100 m² (Relocation), Other
ASML Berlin GmbH, Berlin East, approx. 5,600 m² (New business), Manufacturing
Due to the weak start to the year, take-up in existing properties was also only 91,100 m². This is lower than the two previous years (H1 2022: 129,700 m², -29.8%; H1 2021: 189,500 m², -51.9%), but still higher than in other years such as 2020 (H1: 79,900 m², +14%) or 2018 (H1: 73,796 m², +23.4%).
Nearly 40% fewer leases concluded
The low market activity in H1 2023 is also reflected in the number of deals: We registered 43 deals in total, equating to 37.7% less than 69 in the same period of the previous year. This is 39.4% lower than the five-year average of 71 deals.
In contrast to the same period of the previous year, in which the market was evenly split between owner-occupiers and renters with a ratio of 50.1% (393,400 m²) to 49.9% (391,900 m²), the market in the first half of 2023 was purely a rental market.
In terms of take-up by building type, the majority – 79,100 m² or 69.3% – was attributable to lettings in business parks and only 7,900 m² or 6.9% to (partial) spaces in big-box logistics properties. Other properties contributed the second-most space with 27,100 m² or 23.8%.
Compared to the same period of the previous year, big box lettings’ share in take-up declined by 19.9 percentage points, or 96.2% in absolute terms, compared to 210,300 m². In contrast, business parks increased in significance by a considerable 61.8 percentage points, or 34.1% in absolute terms. Other properties lost the most ground in relative terms with a drop of 42 percentage points or an absolute decline of 94.7% from 516,000 m².
Average full-year result for 2023 in considerable doubt
The only positive sign came from the development of take-up in H1 2023 broken down by quarter: Take-up in the first quarter of 2023 amounted to 51,200 m² and contributed 45% of the take-up in the first half of the year. At 62,900m², the second quarter contributed 55%, which equates to an increase of 23% in the first two quarters.
However, total take-up of 520,778 m² or 260,389 m² per quarter are still required in order for the market to reach the average annual figure of 634,878 m² (five-year average for the full year as of 2022).
Region with the highest take-up is Berlin City
Berlin City was the region with the highest take-up with 92,400 m² or four out of every five square meters taken up (81%). Compared to 145,600 m², its take-up declined by 37% in absolute terms, but it was the sub-market with the biggest gain in share at 62.4 percentage points. We have not registered a share in take-up for Berlin City this high before. In 2020, this sub-market was responsible for 55.4% or just over one in two square metres of take-up.
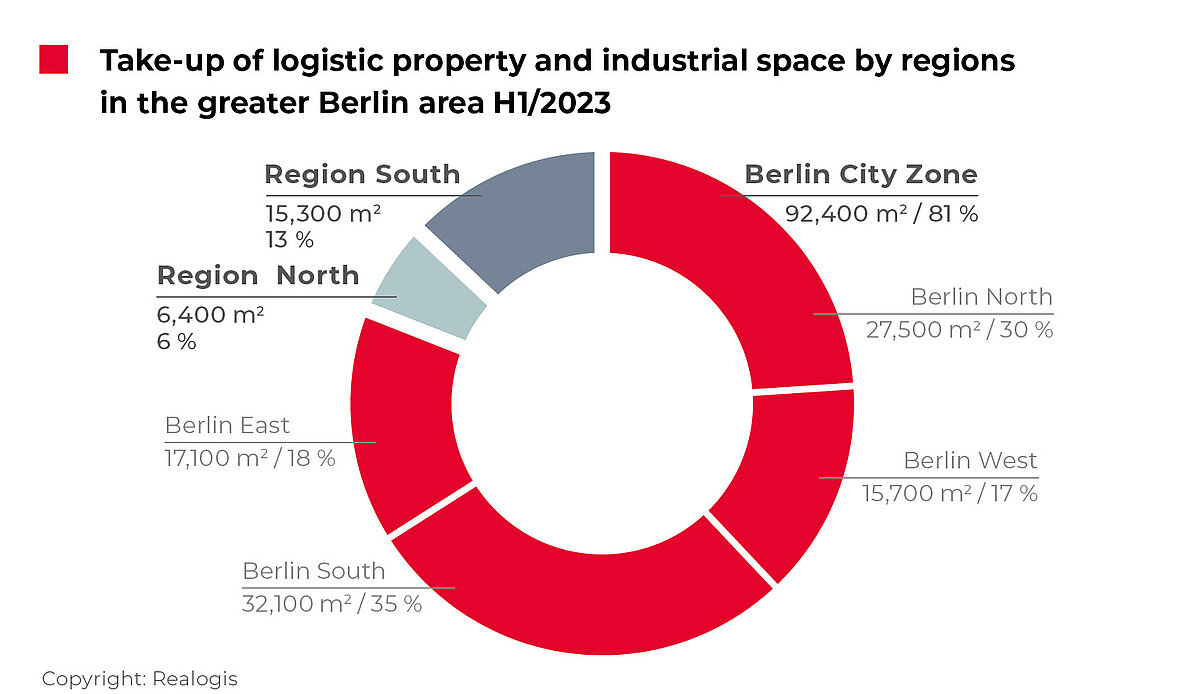
Within Berlin City, the South saw the highest take up of 32,100 m² or 34.7% (H1 2023: 74,200 m² or 51%). One of the biggest deals was the relocation of the Berlin State Opera with 6,100 m² (19% of Berlin South’s take-up).
It was closely followed by Berlin North with 27,500 m² or 29.8%, which saw the biggest increase in its relative share out of all Berlin City areas with 25.2 percentage points. Here was also the location of the deal for the largest amount of space in the first half of the year, namely 15,300 m² by the wholesaler Bär und Ollenroth KG.
Berlin East ranks third at 17,100 m² or 18.5%. The manufacturing company ASML Berlin GmbH leased a unit of 5,600 m² in Berlin East and thus contributed around a third of the take-up.
Berlin West accounted for the least space at 15,700 m² or 17%, compared to 21,100 m². However, the half-year’s second-largest deal was concluded here: The lease for just under 8,000 m² by BLG Logistics Group AG & Co. KG made up half of the sub-market.
Berlin’s surrounding area contributed only 19% of total take-up
In Berlin’s surrounding area, 21,700 m² of space was taken up in industrial and logistics properties and business parks in the first six months, primarily in the surrounding area south of Berlin with 15,300 m² or a total share of 13.4%. Compared to the first half of the previous year, take-up in this sub-market plummeted by 92% in absolute terms from 185,500 m² and dropped 10.2 percentage points in relative share.
The current figure is 83% lower than the five-year average for the first half of the year for this sub-market of 88,459 m². The largest deal was concluded by Flink SE with 6,120 m², which equates to 40% of the region’s take-up (third-largest top deal).
In third place followed the surrounding area north of Berlin with 6,400 m² or a 5.6% share in total take-up. No owner-occupier or rental deals we concluded in either of the surrounding areas west or east of Berlin in the first half of 2023.
Retail leads the sector ranking for the first time since 2020
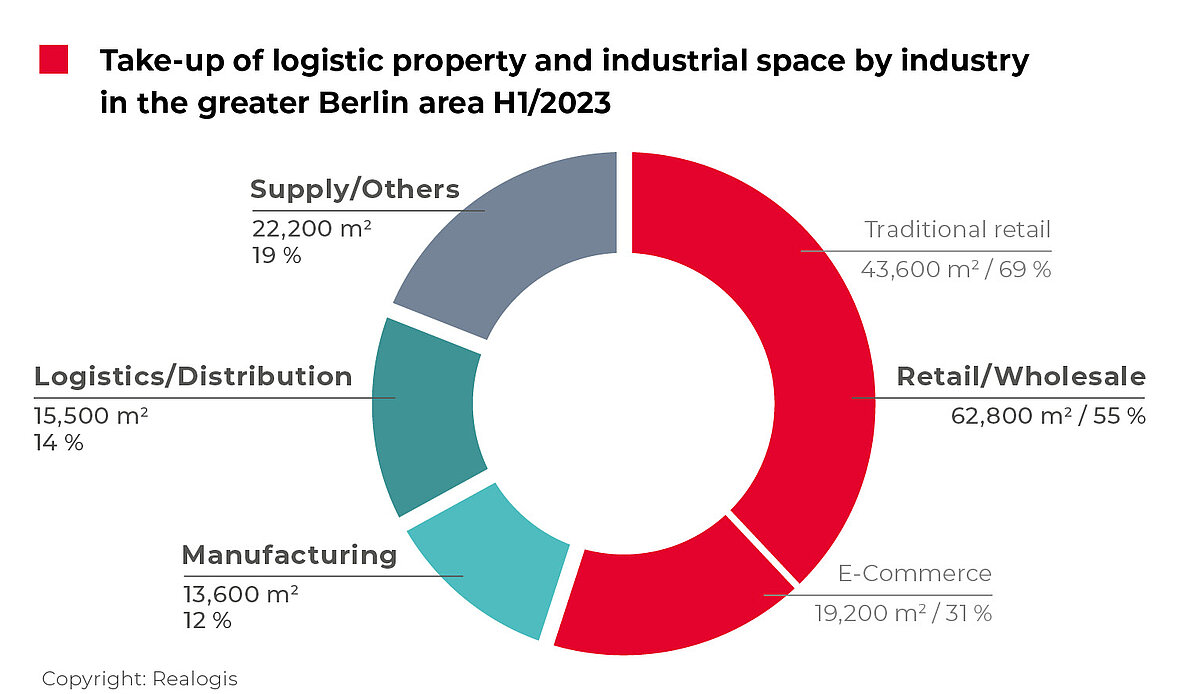
For the first time since 2020, retail is again the leading sector in terms of take-up with 62,800 m² or 55% (2020: 72,640 m² or 47%). Although this is a considerable -70.8% below the take-up in the first half of the previous year of 215,400 m², it is the biggest growth in relative share of all sectors with an increase of 27.6 percentage points. Traditional, brick-and-mortar retail contributed the most to the retail category with 43,600 m² or 69.4%. E-commerce came to 19,200 m² or 30.6%.
The “Other” category ranked second with take-up of 22,200 m² or 19.5%, compared to 53,200 m² or 6.8%. This also included the lease in the South of Berlin City with Staatsoper Unter den Linden.
The logistics/ distribution sector remained in third place with 15,500 m² or 13.6% and a likewise considerable absolute decline of 88.7%. The deal by BLG Logistics Group AG & Co. KG for nearly 8,000 m² contributed 51% or more than half of the take-up.
Manufacturing took last place among all sectors with take-up of 13,600 m² or 11.9% (H1 2022: 379,400 or 48.3%). The deal by ASML Berlin GmbH for 5,600 m² contributed 41% of the take-up here.
This might also be interesting for you:
To the market report Germany
Smaller and medium-sized spaces are dependable
Large spaces of 10,001 m² and above declined considerably compared to the first half of the previous year in both absolute and relative terms and now, at 15,300 m² or 13.4%, are ranked last-but-one or fourth (-62.7 percentage points, absolute decline of 97% from 597,500 m² or a share in take-up of 76.1% in H1 2022). There was only a single deal in this category compared to 12 in the previous year.
Deals for larger spaces between 5,001 and 10,000 m² remain in second place with 25,800 m² or 22.6% compared with 113,200 m² or 14.4%. They also dropped 77% in absolute terms, but their relative share increased slightly by 8.2 percentage points.
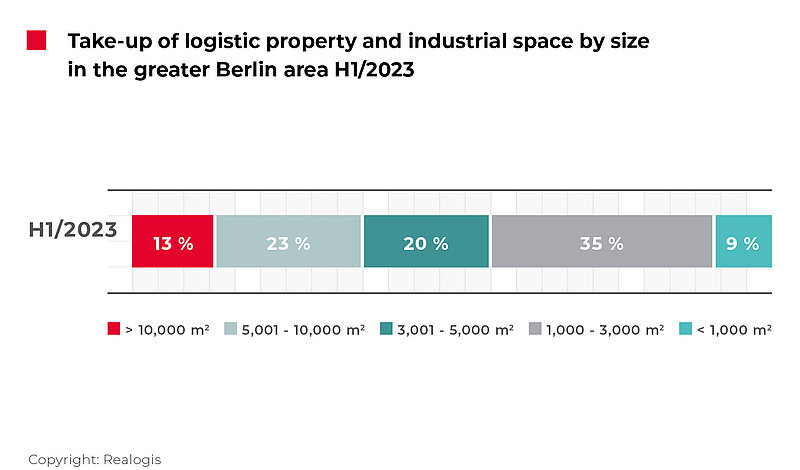
Medium-sized to large spaces between 3,001 and 5,000 m² took third place with 23,230 m² or 20.3%, compared to 18,300m² or 2.3% in H1 2022.
Smaller to medium-sized spaces between 1,000 and 3,000 m² were responsible for the largest share of space in the first half of 2023 with 40,100 m² or 35.1%. Coming from third place in the first half of the previous year, they saw the steepest growth in relative share at 29.2 percentage points, even though they declined by 13.8% in absolute terms (H1 2022: 46,500 m² or 5.9%).
The smallest spaces of less than 1,000 m² added up to 9,700 m² or a share of 8.5% and thus remained in last place in the first half of 2023, compared with 9,800 m² or 1.2%.
Prime and average rents stagnate after price increases at a high level
Prime rent continued the positive trend of the previous years and saw the second-biggest increase since our records began. Starting from the high of EUR 7.90/m² at the end of H1 2022, prime rent has increased by 13.9% in the past twelve months and is currently at the new record level of EUR 9.00/m². This is in line with the figure that prime rent had reached at the end of 2022 as a whole. Since the end of the year, it has therefore stagnated at a high level. The current prime rent is 17.5% above the five-year average of EUR 7.66/m².
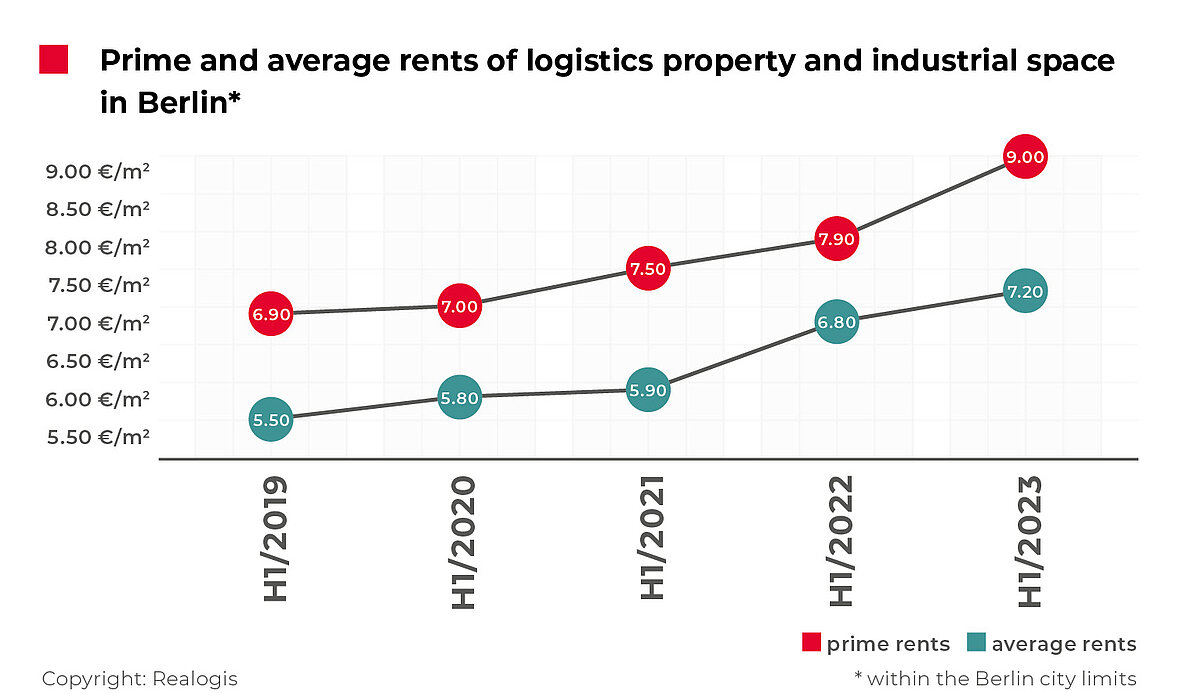
The average rent also increased but more moderately than prime rent with growth of 5.9% to EUR 7.20/m², which also matches the price level of the end of 2022.
After the previous year’s significant percentage increase of 15.3% to EUR 6.80/m² compared with EUR 5.90/m², growth has therefore flattened slightly but remains positive. The current five-year average of EUR 6.24/m² is exceeded by 15.4%.
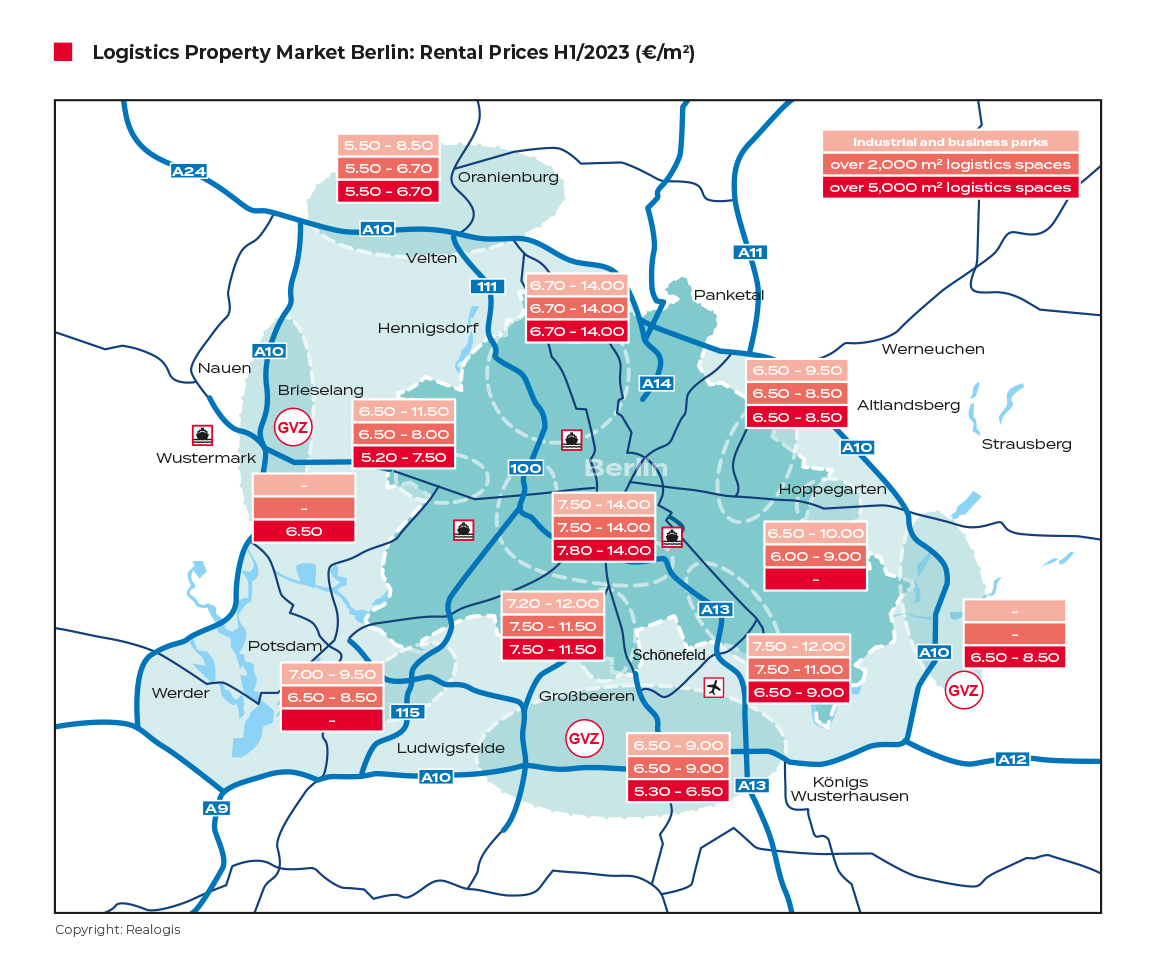
To the rent price maps:
Request the complete market report as PDF